


Use StatCalc to compare summary statistics, develop confidence intervals, and verify hand calculations. Enter data to create descriptive, correlation, and regression statistics. A Decision Tools module is included to explore price elasticity of demand, queuing theory, constant dollars, and decision tables. StatCalc includes example data for each module to help you quickly learn the procedures. A statistics glossary is included. Output is stored in an output log to view and print results. Compare to AcaStat which also provides many of StatCalcs summary statistic procedures.
Includes the features listed below.
Features
-----------------------------------
> Quick statistical evaluation of summary data
> Includes 31 statistical procedures
> Easily create confidence intervals for means and proportions
> Statistics Glossary Module
> Decision Tools (elasticity, queuing, constant dollars)
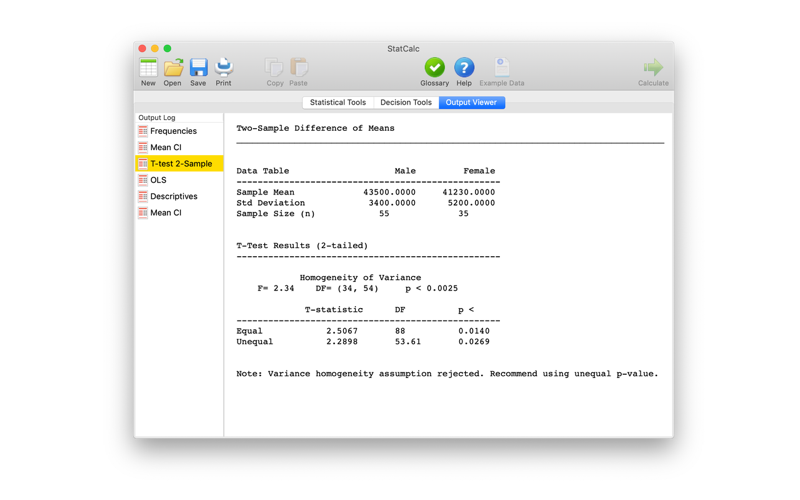
> View, save and print Output
> Import and export delimited text files
> Import AcaStat data files
> Example Data Files for each procedure
> Stat Guide provides interpretation examples
> P-value Calculator
> Enter counts for chi-square and StatCalc will calculate common statistics and create a contingency table with total, row, and column percentages
> Data Manager allows the selection and loading of variables into statistical procedures
> Data limits can be adjusted from 100 to 100,000 observations for frequencies, descriptives, weighted mean, goodness of fit, correlation, and regression
Statistics
-----------------------------------
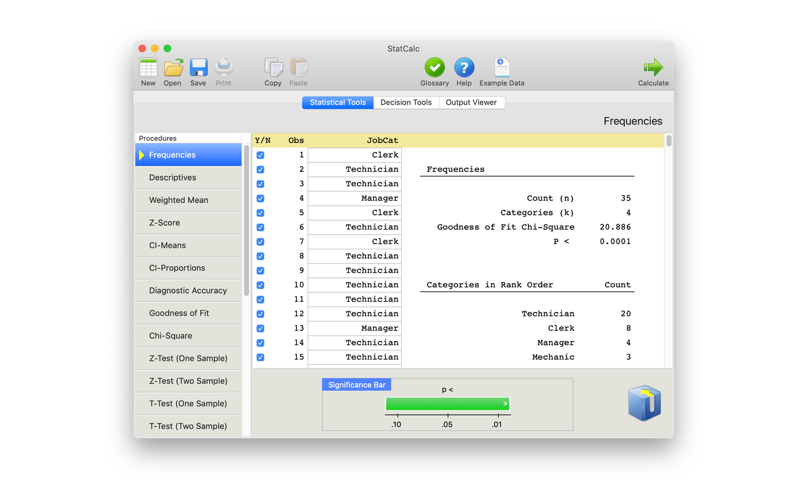
> Frequencies of numerical and string data - count, percentages
> Descriptives - count, sum, minimum, maximum, mean, median, range, population and sample variance and deviation, skewness, standard error, coefficient of variation
> Weighted mean calculator
> Bivariate Correlation - Pearson correlation and correlation matrices
> Simple and multiple regression (OLS) - allows up to 11 variables
> Simple and multiple logistic regression - allows up to 11 variables
> Standardized (Z) Score generator
> Confidence interval for means
> Confidence interval for proportions
> Chi-square Test of Independence and Goodness of Fit
> One-way ANOVA
> Z-test of proportions; 1 and 2 sample tests
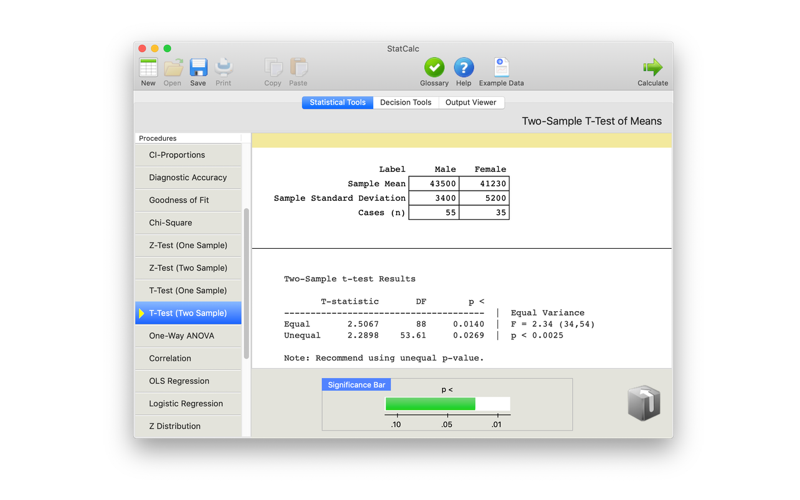
> T-test of means; 1 and 2 sample tests
> Diagnostic accuracy - area under the curve, sensitivity, specificity, positive and negative predictive values, likelihood ratios, kappa
> Z, T, Chi-square, and F Distribution probabilities
> Ten common epidemiology rate and risk statistics
> Decision tables
> Queuing analysis
> Constant dollars
> Price elasticity